Note
Click here to download the full example code
Iris Example#
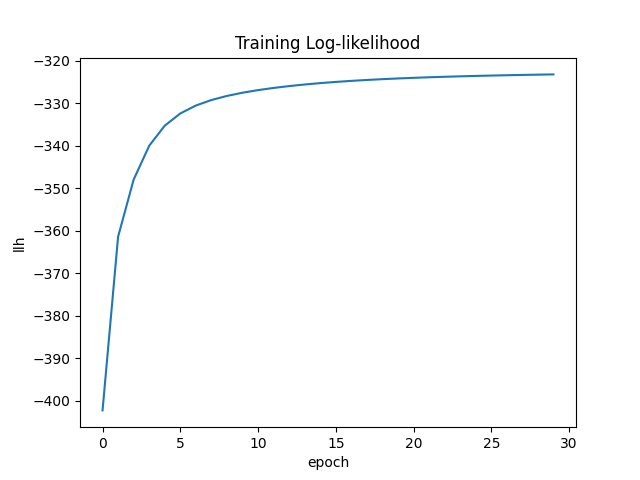


0: -402.3240750820158
1: -361.45228584889423
2: -348.0220810506795
3: -340.0573879779179
4: -335.3278163886216
5: -332.4549610406944
6: -330.5922937737588
7: -329.29473571572913
8: -328.33085520768395
9: -327.57654981646056
10: -326.9628562088111
11: -326.4500213655085
12: -326.0140436921431
13: -325.63946651722404
14: -325.31551710049393
15: -325.0340837766463
16: -324.7886852541951
17: -324.5739518529789
18: -324.38535619726053
19: -324.21905847232455
20: -324.07180191568676
21: -323.94083050247116
22: -323.8238179681566
23: -323.7188046560089
24: -323.62414135773747
25: -323.53844000508434
26: -323.4605310355249
27: -323.38942704632336
28: -323.32429216989556
29: -323.26441650321783
import matplotlib.pyplot as plt
from gtmx import GTMBase
from sklearn.datasets import load_iris


iris = load_iris()
x = iris.data
y = iris.target

gtm = GTMBase(l=1)
gtm.fit(x, epoch=30)
gtm.plot_llh()
gtm.plot('mean', label=y)
gtm.plot('mode', label=y)

plt.show()
Total running time of the script: ( 0 minutes 1.422 seconds)