Beginners’ Guide#
Installing gtmx#
We assume you have Python, then install gtmx with
pip install gtmx
Import module#
Simply import the module like you import other modules
import gtmx
Running examples#
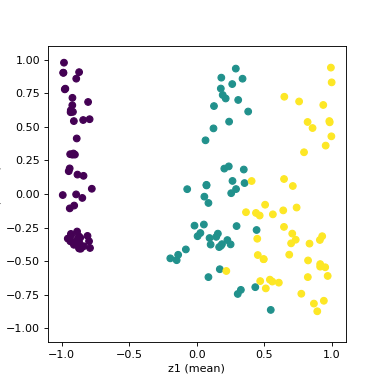
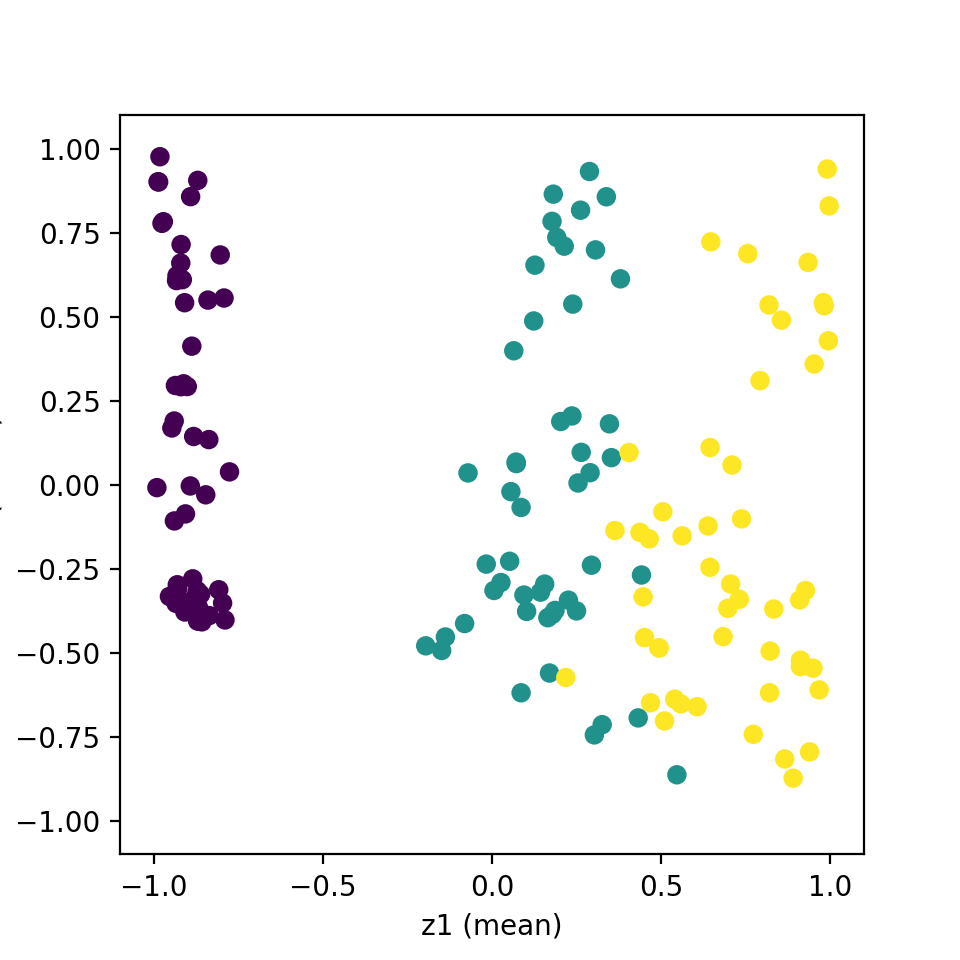
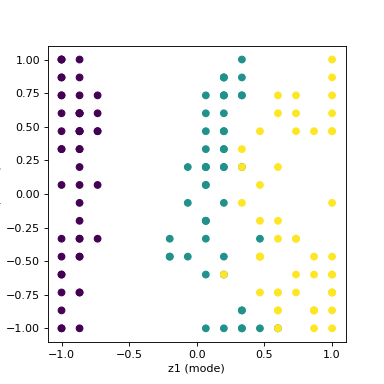
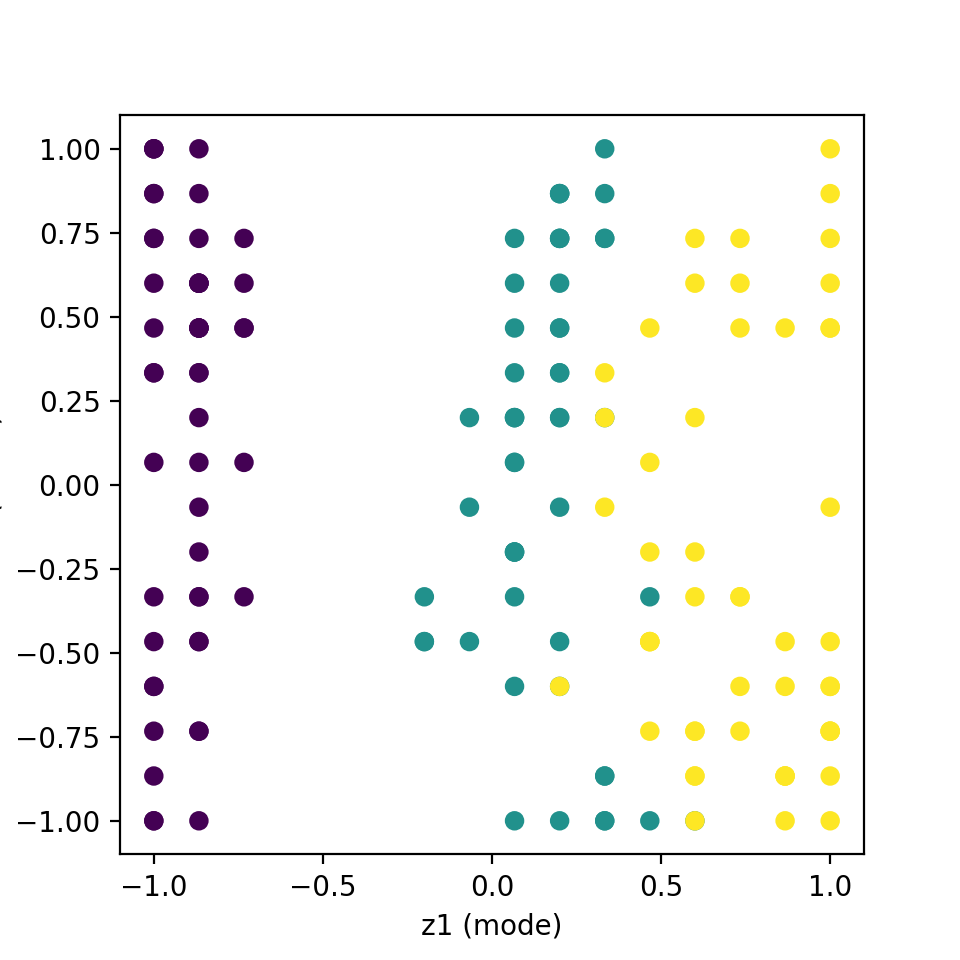
Here we present a simple example that you could use the GTM model to visualize the classic iris dataset.
import matplotlib.pyplot as plt
from gtmx import GTMBase
from sklearn.datasets import load_iris
iris = load_iris()
x = iris.data
y = iris.target
gtm = GTMBase(l=1)
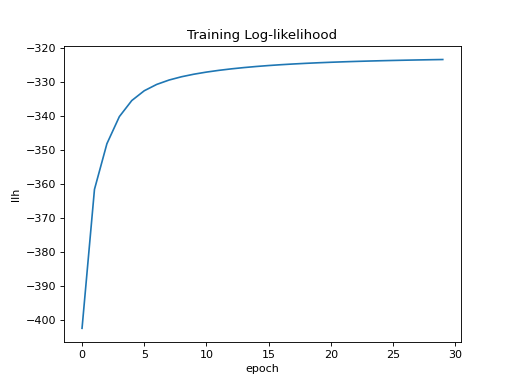
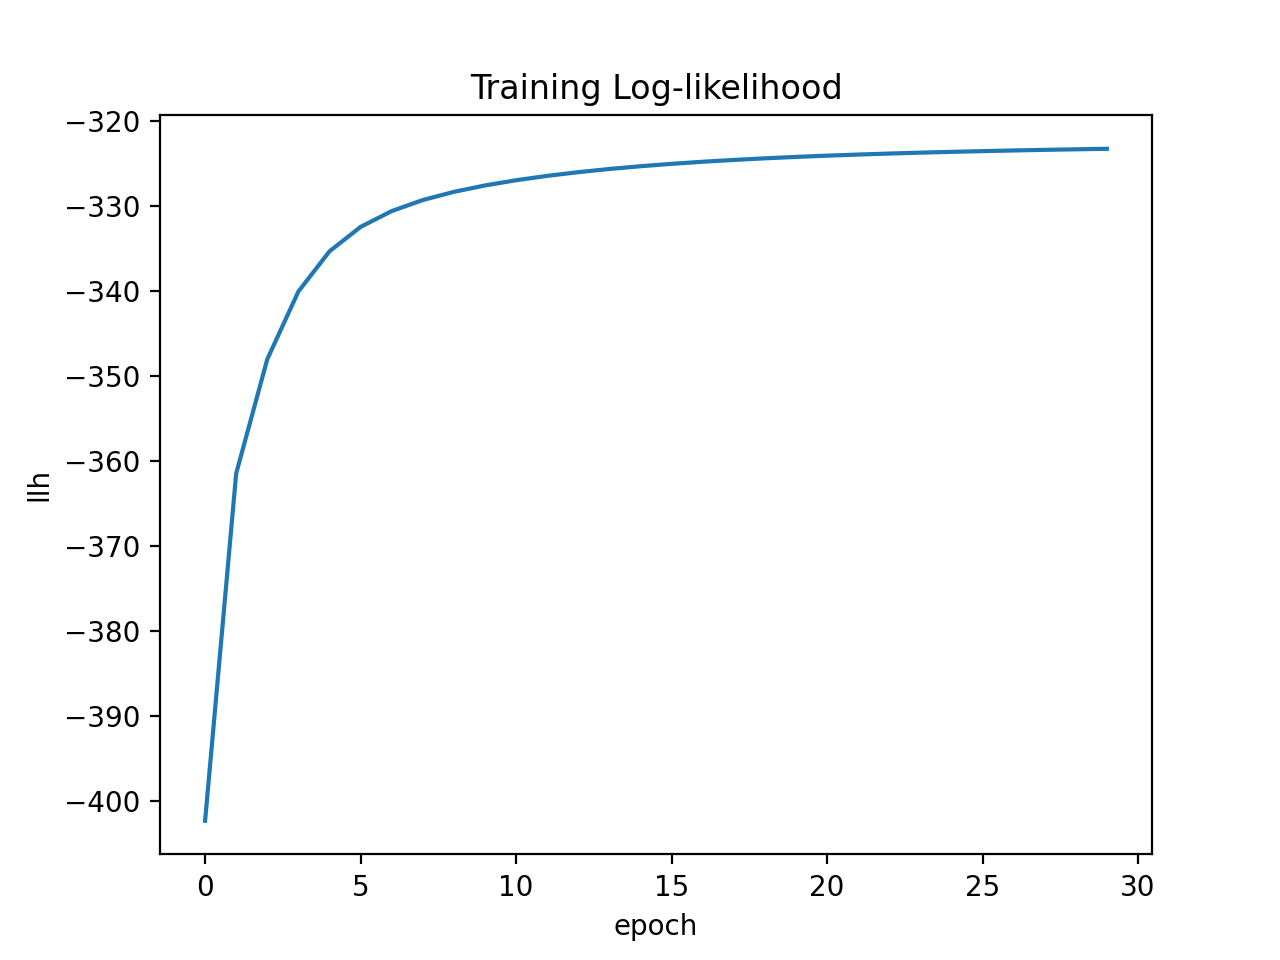
gtm.fit(x, epoch=30)
gtm.plot_llh()
gtm.plot('mean', label=y)
gtm.plot('mode', label=y)
plt.show()
